根据Excel中的类别更改图表颜色
Kutools for Excel
提升 Excel 300+
强大的功能
众所周知,在Excel中创建图表时,将使用Excel默认颜色设置图表。 但有时,您想根据单元格颜色创建图表并为其着色,如下图所示。 当然,您可以使用“填充”和“轮廓”功能逐一更改系列的颜色。 但是,要聪明地处理此工作,您可以尝试 根据单元格颜色更改图表颜色 实用程序 Kutools for Excel.
通过单击Kutools>图表工具>根据单元格颜色更改图表颜色来应用此实用程序。
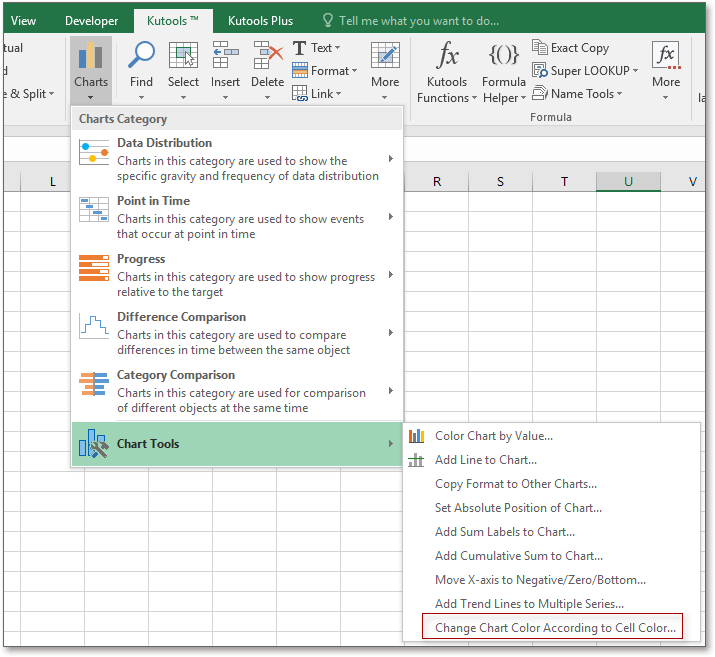
选择要基于单元格更改颜色的图表,然后单击 库工具 > 图表工具 > 根据单元格颜色更改图表颜色.
然后会弹出一个对话框,提醒您操作已完成。 请点击 OK,图表颜色已更改。
 |
 |
生产力工具推荐
以下工具可以极大地节省您的时间和金钱,哪一种适合您?
Office Tab: 在办公室中使用方便的选项卡,作为Chrome,Firefox和New Internet Explorer的方式。
Kutools for Excel: 超过300种Excel高级功能 2021、2019、2016、2013、2010、2007 和 Office 365。
以下工具可以极大地节省您的时间和金钱,哪一种适合您?
Office Tab: 在办公室中使用方便的选项卡,作为Chrome,Firefox和New Internet Explorer的方式。
Kutools for Excel: 超过300种Excel高级功能 2021、2019、2016、2013、2010、2007 和 Office 365。
Kutools for Excel
上述功能只是 Kutools for Excel 300 个强大功能之一。
专为 Excel(Office) 2021、2019、2016、2013、2010、2007 和 Office 365 设计。免费下载和使用 30 天。

![]()
![]()
![]()