根据类别更改图表颜色(在 Excel 中)
Kutools for Excel
提升 Excel 性能,拥有 300+
强大功能
众所周知,在 Excel 中创建图表时,系统会采用默认配色方案。但有时,您可能希望根据单元格颜色来生成并标记图表,如下图所示。当然,您可以通过“填充”和“轮廓”功能逐项手动更改系列颜色。不过,为了更高效、智能地完成此操作,您可以尝试使用 Kutools for Excel 的根据单元格颜色改变图表颜色工具。
应用此工具的方法为:点击 Kutools > 图表工具 > 根据单元格颜色更改图表颜色。
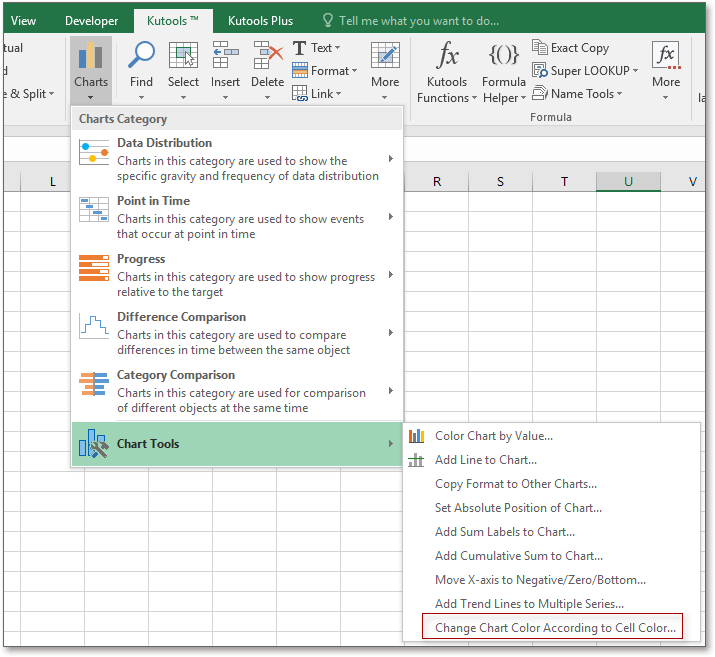

选择您想要根据单元格颜色更改颜色的图表,然后点击 Kutools > 图表工具 > 根据单元格颜色改变图表颜色。
在弹出对话框提示操作已完成后,点击确定,图表颜色即可更改。
 |
 |
高效办公工具推荐
Office Tab:通过便捷标签功能,让 Microsoft Office 也能像 Chrome、Firefox 和新版 Edge 浏览器一样实现标签页操作。轻松切换文档,告别繁琐的多窗口操作。了解更多……
Kutools for Outlook:Kutools for Outlook 为 Microsoft Outlook 2010–2024(及更高版本)和 Microsoft 365 提供 100+ 强大功能,助您轻松简化邮件管理,全面提升工作效率。了解更多……
Kutools for Excel
Kutools for Excel 提供 300+ 项高级功能,助您高效处理 Excel 2010 – 2024 及 Microsoft 365. 上述功能只是众多节省时间工具中的一项。
🌍 支持 40+ 种界面语言
✅ 全球 500,000+ 用户与 80,000+ 家企业信赖之选
🚀 兼容所有现代 Excel 版本
🎁 30 天完整功能免费试用——无需注册,无任何限制
