在 Excel 中快速创建堆叠差异柱形图或条形图
Kutools for Excel
提升 Excel 性能,拥有 300+
强大功能
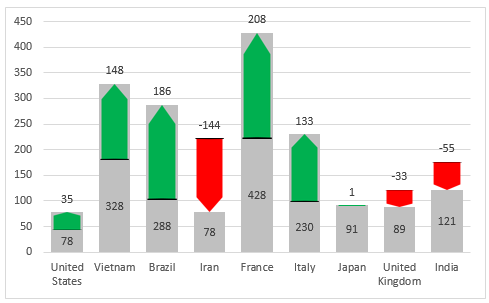
本文将为您介绍一种能够直观展示两组数据变化趋势的图表,如下截图所示。在该图表中,上升的绿色箭头和下降的红色箭头分别代表两组数据的增长与减少。想要快速创建此类图表,使用 Kutools for Excel 的差值堆积图功能,即可根据需求生成堆叠差异柱形图或条形图。

快速在 Excel 中创建堆叠差异柱形图或条形图
安装完成 Kutools for Excel 后,请按以下步骤操作:
1. 单击 Kutools > 图表 > 差异对比 > 差值堆积图,如截图所示:

2. 在差值堆积图对话框中,请按以下步骤操作:
(1.)请选择您要创建的仪表类型,可根据需要选择柱状图或条形图。
(2.)在图表颜色下拉列表中指定您的图表颜色;
(3.)在选择数据区域,分别选择坐标轴标签、第一数据系列和第二数据系列。

3. 设置完成后,点击确定按钮,即可生成如下截图所示的堆叠差异柱形图或条形图:
堆叠差异柱状图 | 堆叠差异条形图 |
 |  |
注意事项:
1. 使用此功能创建差值堆积图时,会弹出提示框,提醒您将创建一个名为 Kutools_Chart 的隐藏工作表,用于存储中间数据。请勿删除该隐藏工作表,否则图表将无法正常显示。

2. 在差值堆积图对话框中点击示例按钮,即可生成包含示例数据和示例差值堆积图的新工作簿。
高效办公工具推荐
Office Tab:通过便捷标签功能,让 Microsoft Office 也能像 Chrome、Firefox 和新版 Edge 浏览器一样实现标签页操作。轻松切换文档,告别繁琐的多窗口操作。了解更多……
Kutools for Outlook:Kutools for Outlook 为 Microsoft Outlook 2010–2024(及更高版本)和 Microsoft 365 提供 100+ 强大功能,助您轻松简化邮件管理,全面提升工作效率。了解更多……
Kutools for Excel
Kutools for Excel 提供 300+ 项高级功能,助您高效处理 Excel 2010 – 2024 及 Microsoft 365. 上述功能只是众多节省时间工具中的一项。
